 By Tyler Durden
Heading into Friday’s payrolls report, the labor market has been enjoying a strong tailing, with the unemployment rate falling to a lower-than-expected 8.4% in August, and consensus is looking for a further decline to 8.2 % in September. In terms of non-farm payrolls, the consensus is also looking for continued job growth of +865k, but as Jim Reid cautions, “it’s worth bearing in mind that having lost over -22MM jobs in March and April, even this figure would mean that just over half of them have been recovered, still leaving nonfarm payrolls over 10MM below their peak back in February.”
Still, considering the continued gridlock over a new fiscal stimulus, if the consensus forecast of 850k NFP proves correct, it will certainly be a continuation of upward momentum with more than 51% of recent job losses recovered through September, leaving employment at 93% of February levels.
That said, there are underlying challenges as BofA writes in report published late last week looking at who is falling behind even as the labor market recovery continues. AS BofA economist Alexander Lin writes,
the pandemic affected the economy unevenly, impacting the lower-income population more than the upper-income cohorts. This has remained true in the recovery as well.
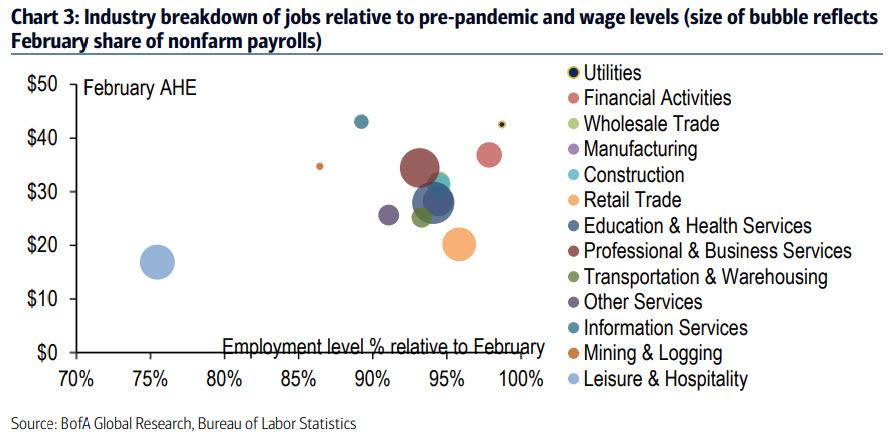
One can see the differences using the industry level data in the nonfarm payroll figures. Leisure & hospitality remains deep in the red and is the lowest paid industry (Chart 3). There are some higher paid industries like mining & logging and information services that remain below 90% of pre-pandemic levels, but they account for much smaller shares of employment.
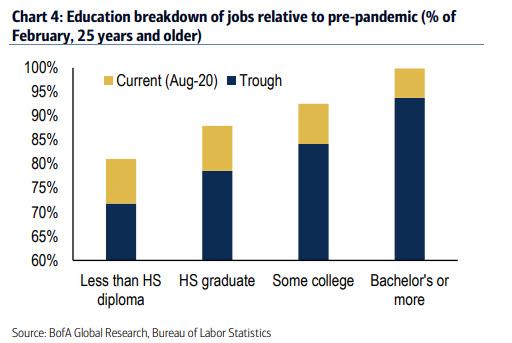
Lin then highlights that employment by education reveals an even starker gap between the high skilled and low skilled. The level of employed with a bachelor’s degree or more saw a peak-to-trough decline of around 6% but has basically fully recovered from those losses through August. On the other end of the spectrum, those with less than a HS diploma have only recovered to 81% of pre-pandemic levels.
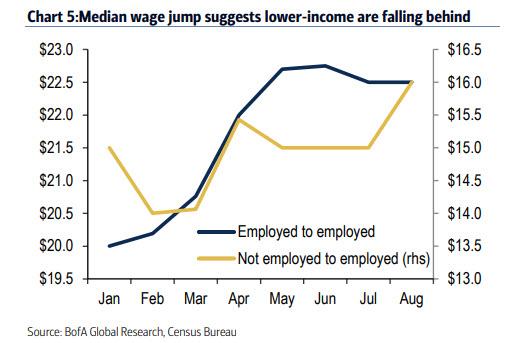
Meanwhile, the dramatic changes to the labor composition have distorted the standard wage metrics, with average hourly earnings last running at 4.7% year over year, a number which analysts expect to accelerate to 4.8% in September. The CPS micro data provide additional perspective, allowing economists to track workers from month to month and their wages over time. It also reveals that the median wage of those that remained employed throughout the pandemic increased, as did the median wage of those that were rehired, which may soon become a challenge to the Fed which is confident wages growth will remain subdued until at least 2023 per its latest Average Inflation Targeting regime.
At the same time, the distribution showed similar results as the 25th and 75th percentiles also increased. This provides further evidence of low-income workers falling behind.
Unfortunately, whereas the BLS calculation of wage growth is highly skewed due to a slower rebound in hours worked, the reality is that wage pressures are likely extremely subdued according to BofA which cites a recent PEW survey (Parker et al., 24 Sep 2020) released this week which found that 32% of adults said they or someone in their household had to take a pay cut due to reduced hours or demand from the pandemic. This stat was also skewed more negatively by income, as 37% of low-income households experienced pay cuts versus 26% of upper-income households.
Long-term problems emerging
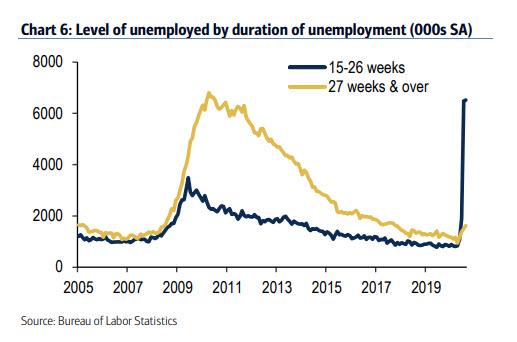
Wages aside, with the pandemic now in its seventh month and labor market slack still elevated, many of the unemployed are transitioning into the “long-term unemployed cohort,” which covers those without a job for more than 26 weeks. To wit, starting in July, the level of unemployed 15-26 weeks spiked to 6.5 million, which is nearly double the previous record high of 3.5 million. The level of unemployed 27 weeks & over may soon follow.
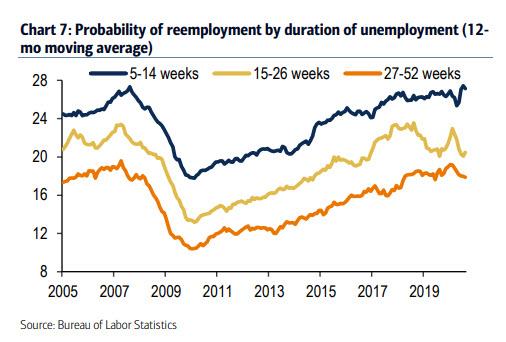
Of course, the longer one is unemployed, the lower the chances they can find another job. As BofA notes, using labor flows, the BLS calculates the probability of reemployment by duration of unemployment. The probability drops from 27% for 5-14 weeks to 20% for 15-26 weeks
It drops further to 18% for those unemployed for 26-52 weeks, with Lin warning that “longer spells of unemployment also lead to lower reemployment wages as skills and employee bargaining power erode.”
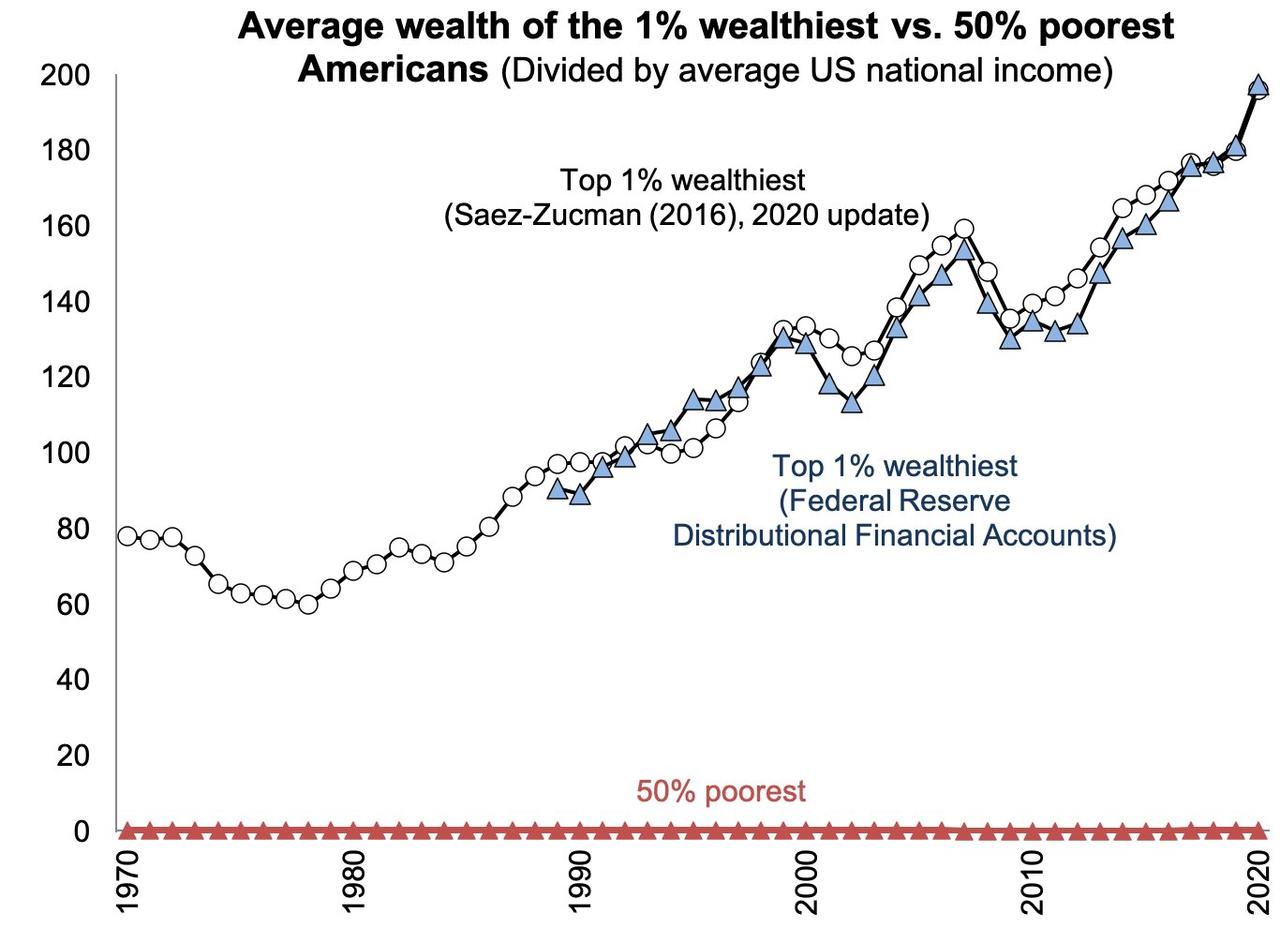
The bottom line is that with the lower-income cohort already falling behind, the odds clearly become more stacked against them over time. The end result is, therefore, even greater income disparity, hardly optimal for an economy where the Fed’s constant manipulation of market has already led to a historic divergence in wealth between the top 1% – which just hit a record 200 year of average income vs “only” 60 in 1978 – and the bottom 50%, whose income has not changed one bit in over 40 years.
Source: Zerohedge
Subscribe to Activist Post for truth, peace, and freedom news. Send resources to the front lines of peace and freedom HERE! Follow us on SoMee, HIVE, Parler, Flote, Minds, and Twitter.
Provide, Protect and Profit from what’s coming! Get a free issue of Counter Markets today.

Be the first to comment on "Which Jobs Have Been Hardest Hit By The Pandemic?"