 By Amelia Janaskie and Peter C. Earle
To this point, the destruction caused by state and Federal Covid-19 lockdowns has largely been expressed in aggregates. Yet along the same line as a popular critique of Keynesianism, economic aggregates present a greatly truncated story by smoothing over minute but revealing evidence at lower levels. Looking at the policy impact on a smaller scale – regionally, and in terms of industries/sectors – exposes the impact of mandated shutdowns in greater detail.
In response to the Covid-19 pandemic, widespread lockdown restrictions were imposed, ostensibly to keep hospitals from being overwhelmed and medical resources from being consumed to exhaustion. Whether policymakers purposely or out of ignorance disregarded them, the tradeoffs of stay-at-home orders were immediate and severe: a massive spike in unemployment, rivaling the Great Depression; similarly historic drops in GDP, and others. By looking at disaggregated data, though, the devastation of lockdowns becomes all the more apparent.
Organization
We examined the US economy in the period leading up to the Covid-19 policy implementations in two ways: regionally and in terms of industries.
For our analysis, U.S. geographic regions are broken into the following areas: New England, Mideast (Midatlantic), Great Lakes, Plains, Southeast, Southwest, Rocky Mountain, and the Far West. These were compared using data on GDP, imports, exports, business formations, and unemployment.
In the second section, industries are grouped and analyzed in a two-fold manner, by specific sector, and by location on the vertical supply chain. The following metrics were used:
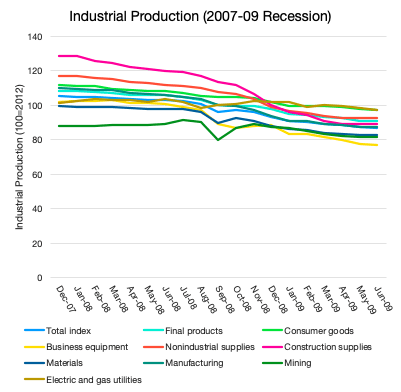
Industrial Production Index: This index (IPI) represents the output of industrial sectors, specifically: consumer goods, non-industrial supplies, materials, and mining. As an index, industrial production is measured against the baseline, which is that 2012 levels were set to 100, and subsequent years compared against it.
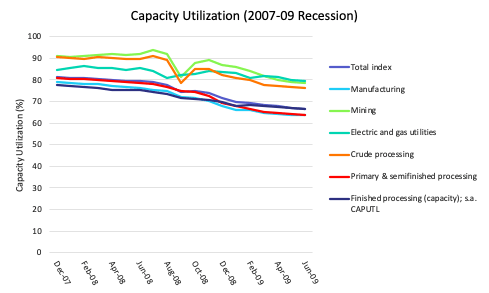
Capacity utilization: Capacity utilization (CU) is denoted as the percentage maximum potential output that is actually utilized. Functionally, this is

Sales/inventory: Sales figures represent, as a dollar figure, the operating revenue of goods sold or services rendered. Inventory is, as a dollar figure, the amount of product that has been produced and stored, but not yet sold.
GDP Value-Add: This metric is the dollar amount that a certain sector/region has on the United States’ Gross Domestic Product (GDP).
Change in employment: This value represents the number of jobs gained/lost in a particular measuring period compared with that of the preceding period.
Although the lockdown clearly and incontrovertibly damaged industries in aggregate, the breakdown shows clearly that the effects were by no means universal.
GDP by Region
Needless to say the United States as a whole suffered economically from the lockdown measures; the degree of economic loss, however, varied widely between regions and their constituent states.

Gross Domestic Product measures the monetary value of all the finished goods and services in a given place and time.
Although NBER dated a recession as having begun during or just after February 2020, Q1 2020 GDP shows only small declines for each region. Yet with the start of the lockdowns, the Great Lakes saw the largest drop in seasonally adjusted annualized rate of GDP by 6.6% between Q4 2019 and Q1 2020. Within the Great Lakes, durable goods and manufacturing GDP contribution dropped furthest negative compared to other US regions: by -0.76% between Q4 2019 and Q1 2020.
Manufacturing is the region’s top industry as it serves as home to a disproportionate number of the top auto and aerospace companies: Ford, Chrysler, GM, Bombardier, Magna International, GE Aviation, and others. The Rocky Mountain region, comparatively, saw the smallest decrease in GDP of 2.8% from Q4 2019 to Q1 2020: that probably owes to its dominant industry, mining, being substantially distanced from the direct impact of lockdowns. It contracted by only 0.05% in Q1 2020.
Q2 2020 reveals massive damage among all regions, with Mideast GDP plummeting the most (34%) and Rocky Mountains the least (27.6%). Among Mideast states, New York’s GDP declined the most: 39.3%. This owes not only to the presence of manufacturing within the Empire State, but the singularly detrimental and long-lasting nature of lockdowns on New York City.
Yet compared against all other U.S. states, Hawaii and Nevada’s GDP plummeted the most: both by 42.2%. Hawaii and Nevada are both heavily dependent on the tourism industry, which in turn rely heavily upon the accommodation, recreation, and food service sectors. This was exacerbated by widespread flight and route cancellations among the major airlines (Delta cut flights by 85% in Q2) as well as suspended services to specific airports – one of which, notably, was Las Vegas McCarran International Airport.
Delaware’s GDP dropped the least of any U.S. state between Q1 and Q2 2020 with a decline of 21.9%. One explanation is the prevalence of financial, insurance, and other administrative jobs in Delaware, a large percentage of which can easily shift to a work from home basis.
Imports by Region
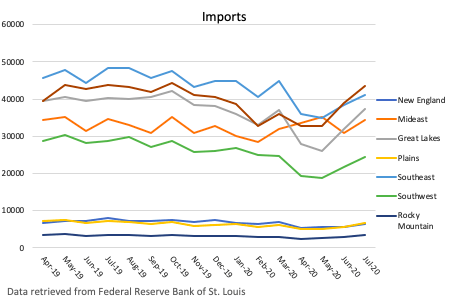
The Southwest, Great Lakes, and Rocky Mountains experienced traumatic shocks to imports between Q1 and Q2 2020. Within these regions, the greatest effects were experienced by Oklahoma (-29.85%), Michigan (-46.83%), and Hawaii (-63.98%).
A number of extremely uncommon events in the global oil industry as lockdown policies were being imposed exacerbated the declines in several of these areas. Oklahoma is part of the Permian Basin, and depends disproportionately upon the oil drilling and processing industries; Michigan depends, as previously mentioned, upon the automotive industry and other heavy manufacturing operations (which in turn is sensitive to trucking). Hawaii, as also mentioned, depends upon air and sea transportation.
One other state not included in these regions, Rhode Island, had a 46.83% drop in imports as well. The steep drop is due to less imports of passenger and commercial vehicles, gasoline, petroleum, and motorboats at the Providence, RI port.
As for best-performing states, New York saw imports vault by 61.93% between Q1 and Q2 2020; this, however, had everything to do with massive shipments of medical supplies to New York City and Long Island hospitals and medical facilities. (Despite an initial, taxing spike in novel coronavirus cases, the greatly feared torrent of desperately ill New Yorkers never materialized.)
Alongside New York State, Idaho’s state imports increased by 19.98% and South Dakota’s by 7.82% between Q1 and Q2 2020.
Exports by Region
State exports are comprised of goods and services leaving the state for both domestic and international destinations. The Great Lakes, Southwest, and Southeast U.S. regions saw the biggest drops in the number of exports; within those regions, Michigan, Texas, and South Carolina suffered the most. For each of those states, their major exports are derived from several of the sectors hardest hit by lockdowns: plummeting output in Michigan’s automotive industry; the extreme conditions which erupted in the oil sector roiled firms in Texas, described in further detail below; as was aircraft/aerospace production in South Carolina.
Conversely, the Rocky Mountain and New England regions experienced less of a decline in exports from April 2019 to April 2020 when compared to other regions despite all still having generally large negative impacts. Although not in these regions, the only state to see a slight increase in exports was Alaska. According to the Anchorage Economic Development Corporation, the Anchorage Airport was the “busiest airport on the globe on some days over the past few months” of 2020 due to the reliance on US-Asia cargo trade.
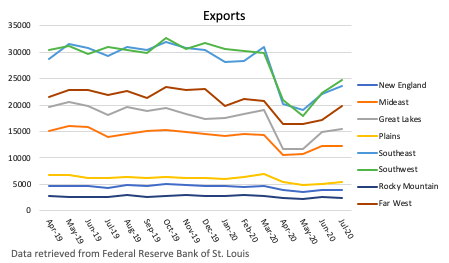
Additionally, when comparing manufactured versus nonmanufactured imports and exports, we can glean a few insights. The Mideast performed well for manufactured imports with a 15.73% increase over the previous quarter, but this is likely due to medical supplies shipped to New York. Nonmanufactured imports, such as farm products or other raw materials, contain the lowest drops. The Great Lakes and Southwest, however, appear to have experienced the greatest blows to overall trade (imports and exports). The Great Lakes accounts for a large majority of US-Canada trade, which has been suppressed by lockdowns. The chart below details the percent change in manufactured and nonmanufactured imports and exports between May 2019 and May 2020. Manufactured goods are products that were mechanically, chemically, or physically transformed, while nonmanufactured refers to raw materials.

Imports, Exports, and the Oil Factor
In early spring 2020, Oil Producing and Exporting Countries (OPEC), Russia and Saudi Arabia found themselves at an impasse, unable to agree upon production levels. Without delving into the minutia of their contention, Russia initiated a price war by entering into unlimited production of oil, driving world oil prices down. In an effort to maintain market share, Saudi Arabia and soon thereafter other OPEC nations “opened the spigots,” so to speak, flooding world markets with oil, sending prices on commodities, futures, forwards, and other markets plunging.
At this point, worldwide demand for oil was plunging due to lockdowns; in April of 2020 more people worldwide were under some form of lockdown than there were people on Earth at the end of World War II. A large portion of Americans were either at home, unemployed, or working from home; business and vacation travel evaporated.
The combination of nonexistent demand and skyrocketing supply led to a spectacle unseen in financial market history: on April 20, 2020, the May 2020 West Texas Intermediate futures contract plummeted 300% to close at -$37.63. The crude oil industry which had since the 1950s developed as an oligopoly (and thus only had to bear supply within predetermined, agreed-upon price ranges) overnight became a de facto free market, and storage disappeared. WTI crude oil, for a limited time, was not only “free,” but traders would pay $37 per barrel to buyers to take physical delivery as the glut filled tank farms and sea tankers.
At the intersection of historically low interest rates and high variable costs of extraction, transportation, refining, and marketing of each barrel, oil firms assumed copious amounts of debt throughout the post-9/11 era. A working assumption is that oil prices would stay above $30 or $40/bbl indefinitely, or at least near the long-term norm. With the colossal collapse in oil prices, many such firms were suddenly unable to service debt obligations.
In addition to the immediate damage of the lockdowns, CNN estimates that the second-order effects will result in 100 firms in the oil industry declaring bankruptcy in subsequent quarters. British Petroleum has already pledged to lay off 10,000 employees by the end of 2020 and Marathon Petroleum has announced that 12% of its staff will be laid off. Chesapeake Energy, long a Fortune 500 company, was delisted from the New York Stock Exchange. Oasis Petroleum, only a few years back trading at roughly $16 per share on NASDAQ, lost 90% of its value; it currently trades at 18 cents per share. Oil firms Noble Energy, Halliburton, Marathon Oil and Occidental Petroleum all lost over 2/3 of their value. Many more jobs, and the jobs that depend upon those, will likely be lost.
Business Applications by Region
Curiously, business applications have actually risen in some regions; notably in the Southeast where an increase of 14.90% between Q1 and Q2 2020 has occurred. The Great Lakes, Plains, Southwest, and Rocky Mountain regions have seen increases as well. The Mideast region evinced a decrease in business applications by 5.85% between Q1 and Q2 2020.
Some explanations for this heartening (if counterintuitive) spike include the following: delays in processing previously-submitted applications once lockdowns went into effect; opportunistic purchases of existing businesses; increased entrepreneurship in the wake of massive regional layoffs; a response to shifting demand in certain products and services owing to Covid-19 and/or the policy responses; or, most likely, some combination of all of the aforementioned.
Unemployment by Region
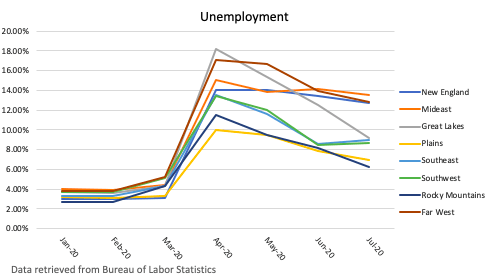
In April, the Great Lakes region experienced the highest levels of unemployment (18.24%) while the Plains region saw the lowest: 9.99%. Within the Great Lakes between March and April 2020, Michigan saw the greatest increase in unemployment rates (19.75%). Other Great Lakes states also significantly increased between March and April: Illinois by 12.95%, Indiana by 14.48%, Ohio by 11.82%, and Wisconsin by 10.5%. Michigan’s construction, manufacturing, and leisure and hospitality industries experienced the deepest impact.
In the Plains region, Nebraska and Minnesota’s unemployment rates increased to 8.7%. Overall, the highest unemployment rate in the US in April was in Nevada at an estimated 30%, with the leisure, recreation, and hospitality-intensive economies of Las Vegas and Reno utterly devastated through Q2 2020.
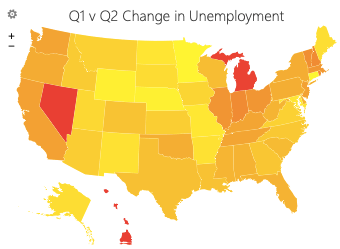

While some regions’ unemployment rates have been falling since their peak in April, several have stayed somewhat level; the Mideast, for example. It is likely that where small and service-oriented businesses are dominant (such as in New York City and certain cities in Florida and California), unemployment rates rose steadily as time drew on.
Overall, the Great Lakes and Southwest regions appear to be struggling the most in terms of imports and exports. As previously mentioned, Michigan, Oklahoma, and Texas rely to a large extent upon industries which are being hammered – manufacturing, auto, and petroleum. Further, though, the proximity of these states to Canada and Mexico (nations with whom trade also slowed to a near-standstill) also contributes to explaining the commercial decline.
Industrial Production and Capacity Utilization
Although the lockdown has had a negative impact on all industries, the magnitude of the damage is not universal. In evaluating the disparity between respective impacts on various industries in the United States, we will use two sets of measures: industrial production & capacity utilization and sales & inventory. As previously noted, the Industrial Production Index (IPI) measures the supply of manufactured goods, and is therefore a strong predictor of GDP.
While the Industrial Production Index (IPI) measures the supply of industrial products, Capacity Utilization (CU) is a measure of demand for goods. Although influenced by consumer sentiment, both industrial production and capacity utilization are influenced by real interest rates.
On March 15, 2020, the Federal Reserve, in response to the coronavirus pandemic, cut the Fed Funds Rate to 0% and initiated a number of 2008-era liquidity programs, in addition to a $700B quantitative easing facility. With tremendous liquidity entering world money and financial markets one would expect both IPI and capacity utilization to increase commensurate with a reduction in the opportunity cost of saving, thus making investments in capital goods, expanded production capacity, and inventories more appealing. And yet beginning in March and at an increasing pace throughout April, both metrics saw sizable declines (see below).
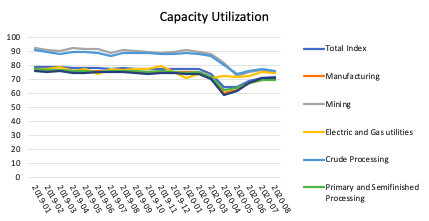
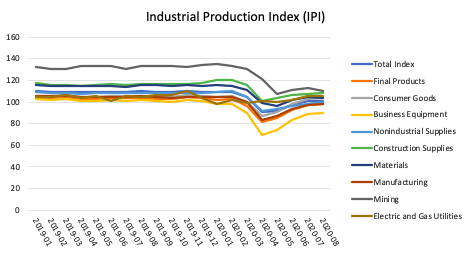
This highlights both the overwhelming degree of uncertainty and the withdrawal of consumers, retail and institutional, from markets as the simultaneous and sudden destruction of both supply (lockdowns forcing the shutdown of plants, etc) and demand (lockdowns resulting both in mass layoffs and widespread sheltering at home, reducing both discretionary spending and overall consumption) collided in the U.S. economy.
Yet not all sectors were damaged equally: business equipment and final products (consumer goods) took the biggest hit whereas the effect on mining, materials, and utilities (capital goods) was milder. With respect to the IPI, between the months of February and April 2020, though business equipment declined a staggering 29.3%, the damage to the utilities sector was just 1.2%; mining lost 8.9% and materials 13.7%.
What is most interesting and unique about this specific recession is that the lockdown impact created a significant ‘kink’ in both IPI and capacity utilization trends. In fact, this sort of disjoint movement in Q2 2020 is vastly and visually different, and more importantly more severe, than even that of the Great Recession between 2007 and 2009. This comparison suggests that a simple, artificial economic slowdown imposed by government policy can have a broader, more devastating effect than what the US endured just over one decade ago: the greatest financial collapse in nearly one century.
So much for Wall Street and its alleged financial “weapons of mass destruction:” a seemingly innocuous, ‘temporary’ lockdown, even if successful in suppressing the daily case curve, will quickly permeate and destroy the economy in ways that even the riskiest derivatives couldn’t come close to.
Industrial Value-Add
Regarding the Value-Add of the Gross Domestic Product, although the aggregate U.S. GDP grew 3.4% from Q1 2019 to Q1 2020, not all industries saw growth.
Of 14 private industries tracked by the Bureau of Economic Analysis (BEA), four declined. While the agriculture, forestry, fishing, and hunting sectors enjoyed a 12.0% growth within this period, the mining industry actually declined 20.3%. However, in Q2 2020, net value-add/loss by sector became more grim. Agriculture, forestry, fishing, and hunting sectors endured a 36.4% loss of on its GDP value-add (which is to say, those sectors’ contributions to GDP decreased) compared to the preceding period; in that same time period the mining sector continued its downward trend, losing 40.7% of its value-add to GDP.
Despite that, the hardest hit sectors were the arts, entertainment, accommodation, and food services – unsurprisingly, due to the strict stay-at-home orders – which lost a staggering 91.5% of contribution to GDP versus Q1 2020. This is particularly noteworthy considering the overwhelming predominance of small, thinly-capitalized and narrowly financed firms within these sectors. Indeed, Yelp estimates that a staggering 61% of restaurants will ultimately close permanently as a result of lockdown policies.
The finance and insurance industry did well, increasing the value generated from Q1 2020 by 11.9% – in no small part, likely, due to the ability of most financial industry employees to work from home.
Industrial Sales and Inventories
Industry sales and inventory provide another angle to gauge both consumer spending habits and supply-side production. Sales data is perhaps the most clearcut way of determining demand; in a strong economy, sales ought to also be high. Inventory is a signal of both supply and demand; it moves directly with production and inversely with sales. Normally, in a recession, one would expect sales to decline, and with it inventories too, as businesses respond to the lack of latent demand, for all industries. Yet, this recession is different in a major way; although both inventories and sales stayed relatively constant upstream (e.g. in manufacturing and wholesale sectors), this was not the case downstream (e.g. retailers). Regarding retailers, inventories tended to decrease significantly during the lockdown whereas sales had little movement, if not slightly increased. This phenomenon can be directly attributed to the lockdown.
ABCT and the Term Structure of Production
An interesting contrast can be made between the Austrian Business Cycle Theory (ABCT) explanation of recessions and the “artificial” nature of the policy-driven lockdown recession. To summarize, ABCT demonstrates that sustained periods of artificially low interest rates and credit creation lead to a distortion in the balance between savings and investment. Lower rates drive borrowing and tend to lead to spending on capital goods; which is to say, goods with longer term structures of production that are used to produce other goods. Examples of these are mining, resources, heavy manufacturing, financial markets, and other such goods which tend to be capital intensive and durable, used in the production of other goods. Less affected by the credit expansion, typically, are consumer goods: those which are usually nondurable have no future use after production: food, clothing, and other nondurables typically intended for immediate or near-immediate consumption.
The shift to longer-term production processes is ultimately unsustainable, and with the end of the credit expansion, no further investments can be found which provide sufficient returns at the prevailing rates of interest. A sharp contraction follows in which malinvestment is liquidated: a cluster of error realized, with firms filing for bankruptcy, projects being abandoned, and assets moving from overly extended concerns to more financially solid enterprises. Unemployment tends to rise as well.
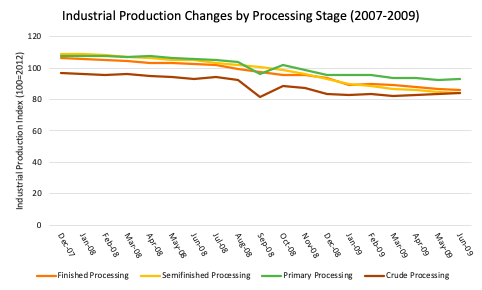
The classic case is depicted in the Great Recession (2007 – 2009). After years of progressively lower interest rates starting not long after the dot-com bust and 9/11, a credit bubble concentrated in mortgages, financial assets, and other sectors had grown, as demonstrated here in the Fed’s “Changes in Monthly Industrial Production by Process Stage” from x to y, the Crude/Processing stage – representing capital goods with the longest term structures of production fell the most when the credit bubble popped. Other stages fell as well, but the degree of distortion driven by low rates and ease of credit is seen to be less severe as the term structure associated with the category of goods decreases. The red periods in the following table depict that shift:
Changes in Monthly Industrial Production Index by Process Stage (2007-2009)

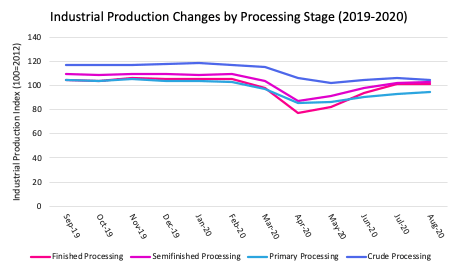
Whereas, in the present case, the deep and sudden recession (and by some measures economic depression) were caused not by the collapse of credit expansion but by policy-dictated business closures, a near total cessation of trade, and the immobilization of the population-at-large. Sudden skyrocketing levels of unemployment fell immediately upon consumers and, with historically low savings rates the opposite pattern materialized (at least initially): consumer goods fell the most, with less of an impact on progressively longer term structures of production as seen here in red:
Changes in Monthly Industrial Production Index by Process Stage (2019-2020)

Conclusion
Even broken down from the aggregate economic statistics into which they are usually combined, these disaggregated economic measures nevertheless gloss over the massive damage caused to the majority of firms that aren’t captured in government data: the Small Business Administration states that 99.7% of all US businesses are small businesses (less than 500 employees) and that 48% of American workers are employed by a small business.
State-enforced lockdowns create uncertainty, which impacts business investment, winnows savings, and destroys consumption at every point along the term structure of production. With the additional factors of price volatility and reduction of resources (e.g. less retained earnings), business owners are likely to become more averse to risk and withdraw from the market, reducing their expenses (reducing headcount and expenditures, cancelling planned investments, etc) as well. Lockdowns – a policy implementation with virtually no precedent throughout American history – have essentially induced an artificial economic recession (and by some measures, a depression). Virtually every business concern, from the much-celebrated “mom and pop” shops to multinational corporations were at some point, and often at several, forced to contemplate and plan for the cessation of business activities, fully or in part.
The lockdown, imposed at various levels, has had a profound impact on every aspect of commerce. Unlike models and other popular representations of business activity, the economy is not a machine and cannot be ‘shut down’ and ‘restarted’ at will; many of the firms which have closed will never reopen, and for uncountable others reacquiring former levels of productivity will be a daunting task, if even possible. So too will many of the unemployed see an inexorable change in the lifetime trajectory of their earnings and wealth.
Although the pandemic itself may have caused some degree of economic retrenchment, the U.S. policy response at all levels tended to emulate the policies of vastly less market–oriented economies although far better examples were readily available. U.S. states with brief or no lockdown measures (e.g. South Dakota and Nebraska) experienced the smallest degrees of economic damage. And predictably, in industries that are most sensitive to lockdown – small firms generally, where most job creation takes place; service industries, which now dominate the US economy; and more broadly any company with jobs that don’t readily convert to a work-from-home basis – the result is wanton destruction and loss.
Join Us
Since January, AIER has been at the forefront of the intellectual battle against scientistic, ruinous government health initiatives. Regrettably even as job growth is beginning to falter again there are calls to reimpose the coercive shutdown policies which have generated so much wreckage and dealt costs far beyond what can even be seen.
Join us. Read and sign the Great Barrington Declaration.
Source: AIER.org
Amelia Janaskie is an intern at the American Institute for Economic Research. She graduated from the College of Charleston Honors College in May 2020 with a B.S. in Economics and minor in English. During her time in college, she was a member of the Market Process Scholars with the Center for Public Choice and Market Process.
Peter C. Earle is an economist and writer who joined AIER in 2018 and prior to that spent over 20 years as a trader and analyst in global financial markets on Wall Street. His research focuses on financial markets, monetary issues, and economic history. He has been quoted in the Wall Street Journal, Reuters, NPR, and in numerous other publications. Pete holds an MA in Applied Economics from American University, an MBA (Finance), and a BS in Engineering from the United States Military Academy at West Point. Follow him on Twitter.
Subscribe to Activist Post for truth, peace, and freedom news. Send resources to the front lines of peace and freedom HERE! Follow us on SoMee, HIVE, Parler, Flote, Minds, and Twitter.
Provide, Protect and Profit from what’s coming! Get a free issue of Counter Markets today.

Be the first to comment on "The Devastating Economic Impact of Covid-19 Shutdowns"