 By Tyler Durden
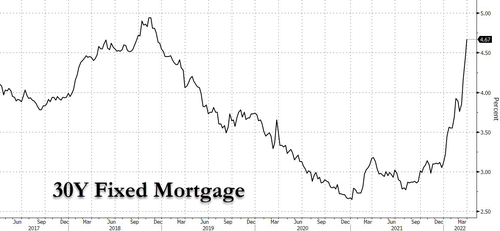
30-year fixed mortgage rates have jumped 160bp this year, reaching the highest since November 2018, with the latest Freddie Mac data showing an acceleration in mortgage rates which jumped a quarter point in just the past week, from 4.42% to 4.67%. This is an even bigger increase than we discussed in our recent Housing comment.
And while the benchmark 10y Treasury yield has also risen, the increase is “only” 94bp. In other words, there has also been a significant widening in mortgage spreads, by 66bp to 243bp. This could be explained by the Fed’s accelerated pivot from QE to QT, the latter of which we expect will be announced at the next FOMC meeting in May.
As discussed one week ago in “Housing Affordability Is About To Crash The Most On Record,” the move higher in rates means that an already record affordability shock will be even worse! As a reminder, we looked at the NAR affordability index and found that the 4.22% on average rate through mid-March, would lead to a record affordability decline of more than -25% yoy. Refreshing the data, Bank of America finds that the decline now looks closer to -30% yoy.
Unfortunately, that’s only the beginning: according to BofA economist Alex Lin, it will probably be even worse than that given the considerable momentum behind home prices, which actually picked up to begin this year with Case-Shiller national home prices accelerating 1.6% mom and 19.2% yoy in January. This move would bring the level of affordability to the lowest since 2007, when the housing bubble was bursting. In other words, not only is housing affordability about to plunge at the fastest rate in history, it will also drop to the lowest rate on record, making housing an asset class which just a select group of US households can afford.
What does this shock mean for actual home prices, sales and – ultimately – the coming recession?
According to Lin, housing affordability tends to lead the trajectory of existing home sales by about half a year. For illustrative purposes, we can draw up a scenario where the existing home sales trajectory matches affordability. This would suggest existing home sales falls below a 4.4mn SAAR pace by September, averaging 5.26mn SAAR over the first 9 months of 2022. That said, the relationship between affordability and existing home sales is imprecise. As a result, this is probably more of a bear case than the base case.
The hit to affordability will likely be only one part of the picture. Another major reason for existing home sales to pullback will be because of the mortgage rate “lock-in” effect. Remember that existing home sales is a measure of housing turnover and will partially reflect owner-occupied households trading up, down, or moving regions. It is likely that the overwhelming majority of these households are paying a much lower mortgage rate than the current market rate, which provides a huge disincentive to move. As a result, demand and supply would head lower.
Easiest way to get your first bitcoin (Ad)
There are signs of this buyer/seller base already withdrawing: according to the NAR existing home sales data, the share of buyers that were previous homeowners slid to 35% in February from 42% in January. Meanwhile, current existing home inventories are already at record lows with months supply SA at 1.9 and actual levels at 966k units.
That said, there will be positive offsets for the existing home sales trajectory. The move higher in rates could lead to a pull forward in demand, which could underpin near-term sales. The pandemic has also led to a shift towards remote work, which could help facilitate migration from high-cost areas to low-cost areas where homeownership is more affordable.
In addition, and this is debatable, BofA notes that household balance sheets are the strongest they’ve ever been with net worth surging to 809% of disposable income, and debt service ratios running near historically low levels (we would counter that applies predominantly to the top 5% who have uniquely benefited from the surge in asset prices; the rest of US households – not so much). Labor markets are booming as well, with job growth averaging nearly 600k over the last 6 months alongside accelerating wage growth. Finally, there are demographic tailwinds with Millennials now in their prime home-buying years.
Source: ZeroHedge
Image: Pixabay
Become a Patron!
Or support us at SubscribeStar
Donate cryptocurrency HERE
Subscribe to Activist Post for truth, peace, and freedom news. Follow us on SoMee, Telegram, HIVE, Flote, Minds, MeWe, Twitter, Gab, What Really Happened and GETTR.
Provide, Protect and Profit from what’s coming! Get a free issue of Counter Markets today.


Be the first to comment on "Biggest Housing Affordability Shock In History Incoming"