 By Tyler Durden
As BofA’s European credit strategist, Barnaby Martin, puts it in one of the final issues of his European Credit Strategist report for the year, “2020 is ending with one of the most predictable and potent themes of the last decade: central bank activism.”
Case in point: on Thursday the ECB doubled down on more of the same as it delivered more PEPP, longer PEPP, further reinvestments and an extension of favourable TLTRO conditions. According to Martin, “while not as novel as some of the ECB meetings gone by, the aim of Thursday’s package was to maintain “favorable” funding conditions across all markets (to ensure the swift return of business and consumer confidence).” For those who missed it, this is what the ECB did, to quote Martin:
Lagarde gave bond markets another dose of PEPP: a €500bn increase in the envelope and an extension of buying until March 2022. Thus, big QE will still be with markets for some time.
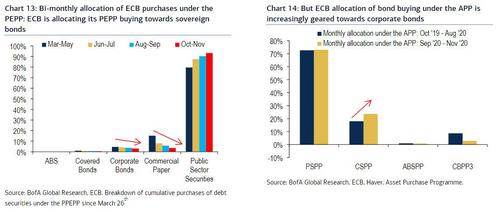
But as this week’s PEPP disclosure shows, the programme is now almost exclusively about buying government debt (Chart 13). Instead, weekly APP has become more relevant for gauging the pulse of ECB corporate bond buying (Chart 14). Notice how the share of corporate bond buying has been rising here.
Although the euro spiked and markets appeared initially disappointed by the ECB’s measures, by the end of the day “longer-end rates had rallied and IG credit spreads were broadly unchanged” Martin writes and adds that “what’s clear is that financial repression lives on for another year…a bullish backdrop, which will continue to elicit a thirst for yield across debt markets, in our view.”
Just in case it’s not that “clear”, the BofA strategist explains that the message from the ECB is that “the key message underlying everything was that favourable financing conditions must be preserved across all markets: banks, sovereigns and corporates.” And as he further notes, what the ECB did “should be thought of as akin to Yield Curve Control for credit.” Which also means that if corporate yields are under lock and key for 2021, “then credit vol likely will sink further next year, continuing to support the thirst for yield and compression trade in credit.”
That said, while anyone who has dared step in front of hits liquidity firehose, which as we noted on Friday amounts to $1.3 billion in asset purchases every hour, has been absolutely crushed…
… there is a distinct risk as we head in 2021.
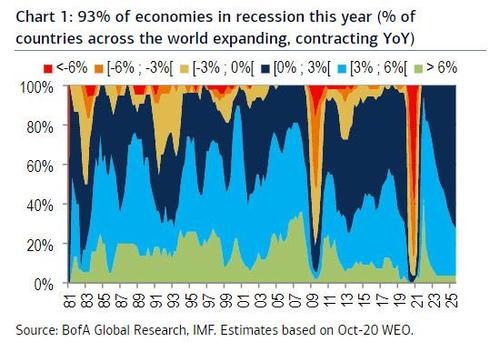
First some context: as Martin puts it, “it’s hard to escape how powerful the policy “supernova” has been this year, against a backdrop of historically horrendous growth.” And just to put it perspective, his next is absolutely staggering: “2020 is ending with 93% of economies across the world having contracted (Chart 1), with 53% shrinking this year by more than 6% (versus just 17% of economies in 2009).”
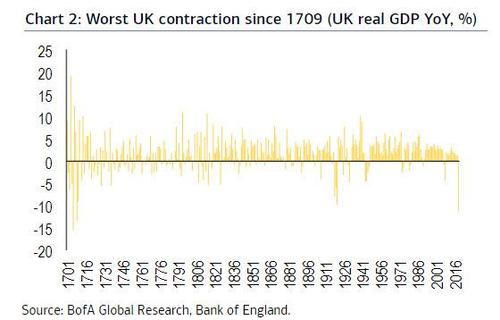
At the same time, global stocks are trading at all-time highs, and 2020 is ending with 70% of European IG bonds having tightened year-to-date now, almost entirely because of the monetary support heaped on markets by central banks in Q2. According to Martin, this dichotomy is nowhere greater than in the case of the UK, whose expected contraction (BofA estimates -11.3%) will go down as the worst economic decline since 1709, according to Bank of England data (back then, the “Great Frost” scuppered global trade, leading to significant food shortages and deaths). Nonetheless, Sterling credit has generated excess returns of +3.2% year-to-date.”
Far from a blessing however, Martin counters that for long-term IG credit investors, this unprecedented rally combination has created a negative yielding headache, as the new year dawns:
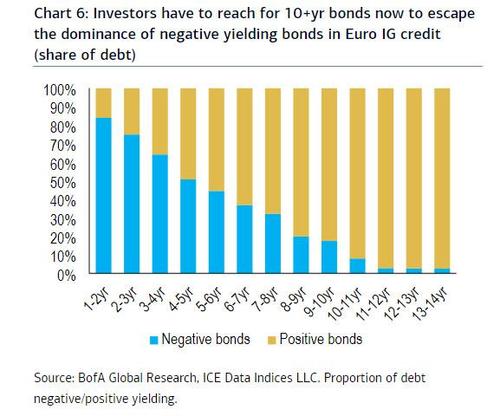
- The average IG corporate bond yields are now just 19bp,
- Average 1-5yr corporate bond yields stand at just 1bp,
- and investors have to buy 10yr credit, or longer now, to avoid the problem of negative yields (Chart 6), implying credit duration will likely become very crowded next year.
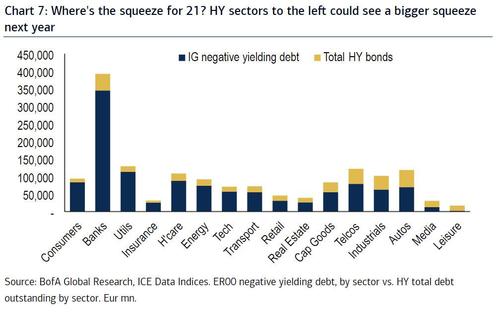
As Martin said previously, credit compression is the clear theme that has to emerge from this, as IG investors lose enthusiasm for negative yielding bonds and surf for opportunities elsewhere…such a junk. To be sure, high-yield has been a remarkable beneficiary of this liquidity gusher. But note the “squeeze” potential as this reallocation plays out. Chart 7 shows the total amount of IG negative yielding bonds, per sector, versus the total outstanding of HY debt, by sector.
According to Martin, sectors to the left of the chart have a much bigger share of negative IG debt, than available HY bonds. Other things being equal, these high-yield sectors will be most prone to the squeeze effect next year.
There is another, bigger issue: as Martin’s colleague, BofA CIO Michael Hartnett has argued for the better past ofd the past two months, the “Goldilocks” combo of recovering growth and steadfastly dovish central banks points to the growing risk of hubris in 2021 (and therefore market “wobbles”) as central banks may face a sudden reflation burst that puts in doubt their determination not to hike until 2023.
Finally, and worst of all, even though it is only a matter of time before a big “wobble” hits, assets now have virtually no margin for error, so anyone buying here is virtually assured of losses:
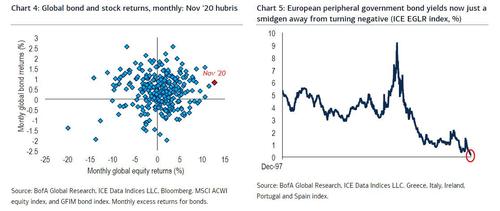
- Note that November ’20 was not only a record month for many global equity markets (ex-US stocks, for instance), but it was also a strong month for global fixed-income returns…a rare combination (Chart 4),
- And periphery debt has rallied so strongly of late, that average peripheral government debt yields are now a smidgen away from turning negative (Chart 5).
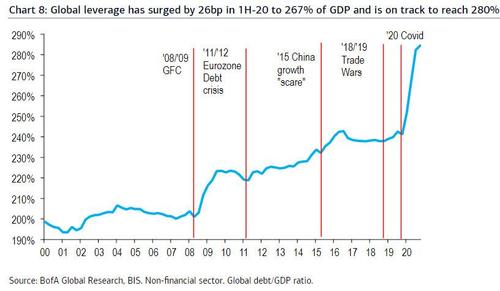
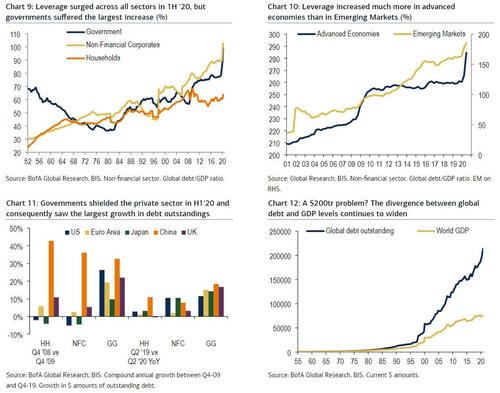
Of course, there is another glaringly obvious reason why the piper will have to paid for the euphoria of 2020, and that’s the ugliest four letter-word of them all: “Debt” – as Martin notes – has been synonymous with the 2020 COVID crisis, as economic shutdowns have battered sovereign revenues (leading to record budget deficits) and governments have unleashed a fiscal firehose to protect society from collapse. The latest BIS debt data now available for Q2, shows jumps in debt/GDP of “epic proportions” in this crisis:
- The global debt-to-GDP ratio surged to an all-time high in 1H-20 of 267%, jumping 11pp in Q1 ’20 and then a further 15.7pp in Q2 ’20. This is the largest QoQ change on record (Chart 8).
- While global debt/GDP surged everywhere, it was governments that sustained the biggest increase in leverage, with the global sovereign debt/GDP ratio jumping 21pp in 1H’20 to 99.3% (Chart 9).
- In this crisis, governments have sought to shield the private non-financial sector, and households. Accordingly, global non-financial sector debt/GDP ticked-up by “only” 10pp in Q2 ’20, vs Q1 ’20. Households’ debt-to-GDP rose by only 3pp.
- Advanced economies, which were at the centre of the Covid-19 outbreak in the spring and the autumn, have deployed greater policy measures than their Emerging Markets (EM) peers. Hence the sharp 25pp increase in debt/GDP this year for the former (Chart 10).
- The global economy added $11tr of debt in 1H ’20, a record, while the Covid-related recession shaved near $4tr to the global output (Chart 12).
- Non-financial corporates (NFCs) in the largest economies have increased debt to build up cash buffers in this crisis (Chart 11). This is a striking difference with the Global Financial Crisis (GFC) in ’08/’09, when NFCs, especially in the Euro Area, focused on debt reduction.
And some more terrifying charts:
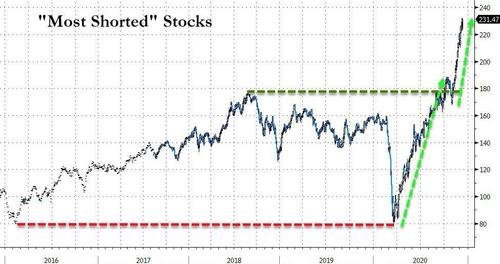
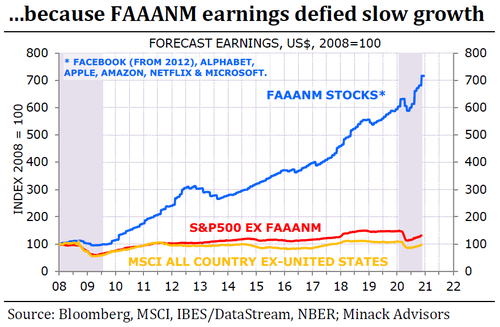
For now this unprecedented debt tsunami is not an issue, but the moment inflation does pick up in earnest and the selling of duration (and by implication the ultra-high duration “growth” stocks which have led the S&P for the past decade…
… begins, we suggest you panic.
Source: Zero Hedge
Subscribe to Activist Post for truth, peace, and freedom news. Send resources to the front lines of peace and freedom HERE! Follow us on SoMee, HIVE, Parler, Flote, Minds, MeWe and Twitter.
Provide, Protect and Profit from what’s coming! Get a free issue of Counter Markets today.

Be the first to comment on "2020 Is Ending With 93% Of Global Economies Contracting … With Markets At All Time Highs"