
In the ongoing struggle to write the history of the pandemic years, nothing is more important than mortality – did the world’s governments save us from mass mortality or not?
The grand strategy (which as I have said before was neither grand nor strategic) was to lock down the population of whole countries as an interim measure ‘until a vaccine becomes available.’
This was a novel (and completely unproven) strategy to defeat a supposedly completely novel virus, on the grounds that no human had ever encountered anything like SARS-CoV-2 before so no one would have any pre-existing immunity to it. But the clue is in the name – SARS-CoV-2 was named after SARS to which it was closely related, sharing approximately 79% of its genome sequence according to this paper in Nature. It is situated within a cluster of coronaviruses, and another Nature paper discussed the extent of cross-reactivity with these including the common cold viruses, and even with other families of viruses altogether. It was somewhat novel, but not unique.
So, policymakers should have been skeptical about the claims made early in 2020 that SARS-CoV-2 would produce extreme levels of mortality. This has consequential implications for the claims that the grand strategy was a success because these levels of mortality did not eventuate. If they were never going to happen, then we did not need to be saved from them.
The deployment of vaccines was supposed to bring about ‘the end of the pandemic.’ The clinical trials of the vaccines purportedly showed they could reduce symptomatic infections by over 90%.
At the population level, this does not add up. If over 90% of infections were supposed to be prevented by vaccination, and 270 million people in the US population had been vaccinated by the end of May 2023 (out of a total population of around 340 million), then how come there were over 100 million confirmed cases by then, according to Our World in Data? It defies belief that nearly 100 million of the unvaccinated 170 million were the ones infected. Particularly as a study by the Cleveland Clinic showed that on average the more vaccinations people had, the more likely they were to be infected:
It was assumed there would be a consequential reduction in mortality from reducing infections (which in any case does not appear to have happened), but the clinical trials did not show any differences in mortality between the groups exposed to the vaccines and the placebo groups. The orthodox defence is that they were not powered sufficiently to detect any differences as the trial populations were not large enough. But by the same token, we are entitled to draw the following conclusion: the clinical trials did not demonstrate the vaccines’ ability to reduce mortality.
In the quality assurance business, we evaluate the success of an intervention or program by comparing the actual outcomes with the claims made.
The reality is that waves of infection and excess mortality continued after the deployment of the vaccines during 2021, continuing with two severe waves in the United States, and peaking again at the end of January the following year. There was a trend of declining peaks, but it is not evident that this trend changed as a result of the vaccination campaign, as it would be expected over the course of any pandemic.
Conventional wisdom would have us believe that the vaccines, while they may not have reduced overall levels of infection, somehow reduced levels of hospitalization and mortality from Covid-19. Again, it defies belief that vaccination could be deficient in preventing infection and still be successful in reducing illness.
These claims of success do not rest on hard evidence.
A number of recent papers are smoking guns that show us that the grand strategy did not work. We need to look beneath the hood, however (to switch metaphors,) because the narrative usually concludes that the strategy was a success. The data however sometimes tell a different story. This shows that the authors are biased, and their data can be more reliable than their narratives.
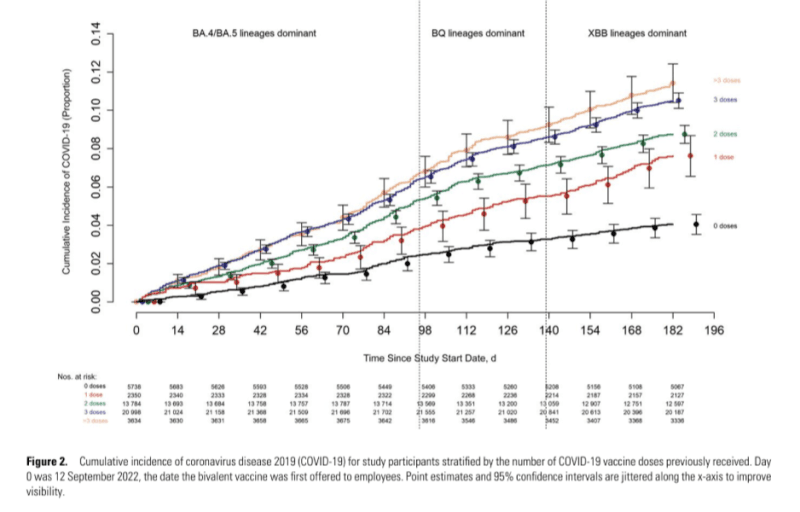
Take, for example, a study by Bajema et al. based on patients of the US Veterans Health Administration. They concluded:
This cohort study showed that, during the 2022 to 2023 season, infection with SARS-CoV-2 was associated with more severe disease outcomes than influenza or RSV, whereas differences were less pronounced during the 2023 to 2024 season.
During both seasons, RSV remained a milder illness, whereas COVID-19 was associated with higher long-term mortality. Vaccination attenuated differences in disease severity and long-term mortality.
This seems conclusive, doesn’t it?
But the conclusions are based on the data summarised in Figure 2A, which includes:
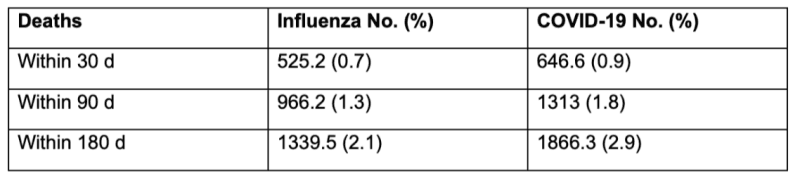
On these figures, it is literally true that Covid-19 mortality was more severe over 180 days – but by less than 1 percent. This was meant to be the once-in-a-100-year pandemic that would cut a swathe through the population and was dramatically more dangerous than influenza, necessitating throwing the whole world into a state of emergency. Was this justifiable for a disease that had less than 1% higher mortality than influenza? Many media articles have derided claims that Covid-19 posed a similar burden of disease to influenza, but over time it has proved to be comparable.
How much did vaccination help? Figure 2 gives us these comparisons for the Covid-19 patients.
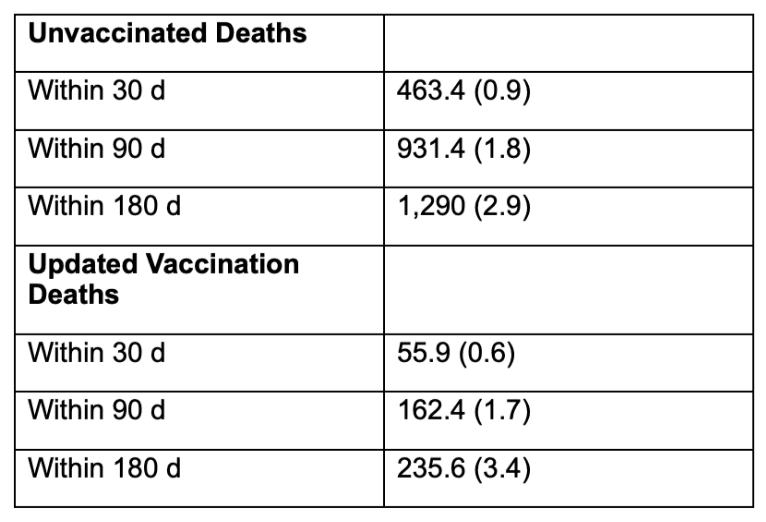
So, in a paper based on a carefully selected and processed sub-population of a sub-population, the vaccinated were ahead by half of one percent over 180 days. Is this the best they can do? Is it statistically significant?
Papers based on the excess mortality in the whole population of a country can avoid the methodological issues caused by variability in the attribution of mortality to Covid-19 and the selectivity of trial populations. Of note is a recent preprint by Dahl et al: Covid-19 mRNA-vaccination and all-cause mortality in the adult population in Norway during 2021-20: a population-based cohort study. They too reach the obligatory conclusion:
Vaccinated individuals had a lower rate of all-cause death during 2021-2023 in Norway.
But again, how does the data support this conclusion?
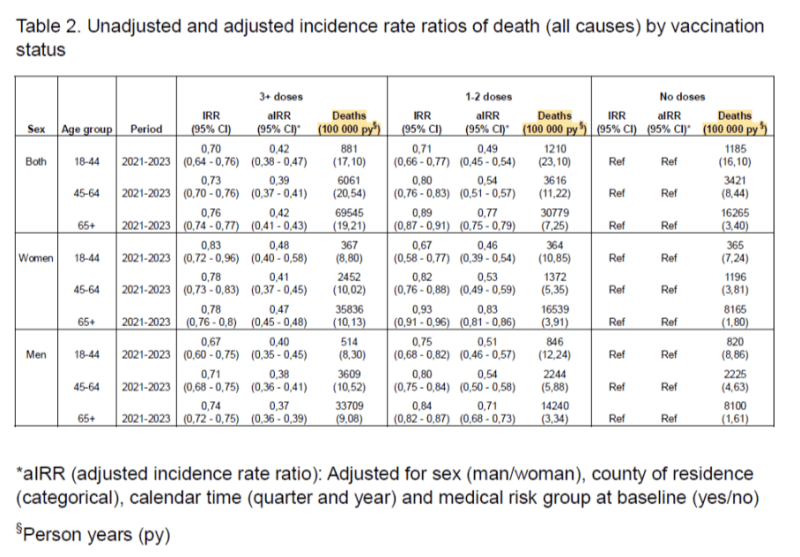
If we focus on the data for both sexes and read from right to left, deaths per 100,000 py increase steadily for each age group except for the youngest, where deaths would have been rare.
By contrast, for the oldest age group (65+), they increase from 3.40 with no doses, to 7.25 with 1-2 doses, to 19.21 with 3+ doses. What obscure statistical magic did they deploy to arrive at incident rate ratios that go in the opposite direction to deaths per person-years? And why do they not explain this in the narrative?
On a plain reading of the figures behind the text, all-cause mortality in the vaccinated was at least twice as high as in the unvaccinated during this time period in Norway. But they concluded the reverse.
So, the first thing we need to demand from our scientists is that they reach conclusions that are clearly supported by the data!
Papers on vaccination are critically weakened by confirmation bias. The strength of the authors’ belief in vaccination is such that all data is usually interpreted as supporting vaccination, even when it is contrary.
Another broad study was undertaken of all patients diagnosed with Covid-19 in Brazil over the period 2020 to 2023 by Pinheiro Rodrigues and Andrade. Their conclusion was summed up in the abstract:
The protective effect of COVID-19 immunization was observed up to one year after the first symptoms. After one year, the effect was reversed, showing an increased risk of death for those vaccinated.
This is illustrated in Figure 1, with number of days of survival along the X-axis:
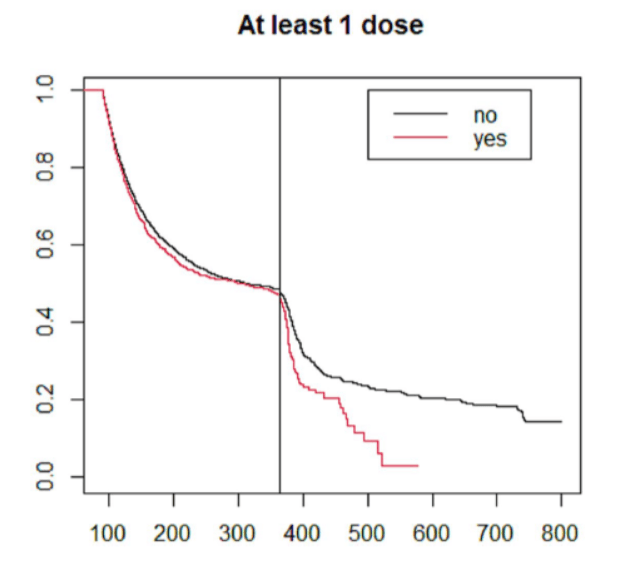
We must congratulate these authors for reaching conclusions that accurately reflect their data, which is unusual in this context. This has naturally led to the paper being investigated by the journal post-publication, which never happens for papers that reach orthodox conclusions on vaccination which are normally accepted at face value. Publication bias is rife – how will the distinguished peer-reviewers handle the Dahl paper? The fate of these two papers will be a key test. On current form, you would expect the Brazil study to be retracted and the Dahl paper to be accepted.
The studies that reach positive conclusions are either based on selected periods of time (variations on what is known as case-counting window bias) or on modelling.
Take for example Christopher Ruhm’s cross-sectional study of US states which aimed to ascertain whether state Covid-19−related restrictions (nonpharmaceutical interventions or NPIs + vaccine mandates) affected the number of pandemic deaths in the US. The study was based on data from the entire US population, so it was inclusive in that sense. Ruhm concludes:
This cross-sectional study indicates that stringent COVID-19 restrictions, as a group, were associated with substantial decreases in pandemic mortality, with behavior changes plausibly serving as an important explanatory mechanism.
The giveaway however is the time window: ‘The primary investigation covers the 2-year period July 2020 to June 2022.’ What about the earlier months? This is important because the first wave of Covid-19 mortality hit the Northeast states heavily and is omitted from the window. Subsequent waves hit the Southern and Western states so variations in excess death rates over the period were heavily influenced by geography, which is likely to have been a confounding factor. This is evident in Figure 2C for the study period:
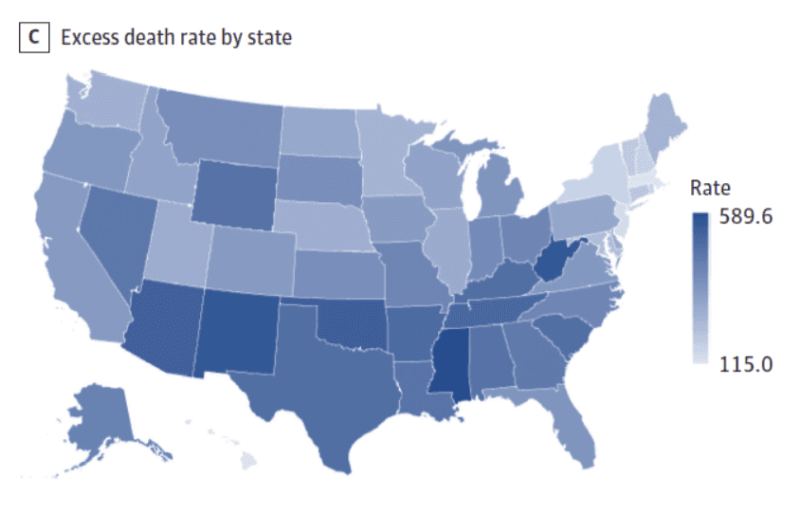
Figure 2E includes the earlier period and clearly shows a reverse pattern then, with states having more severe NPIs (‘above median’ – the orange line) having much higher mortality than those that did not.
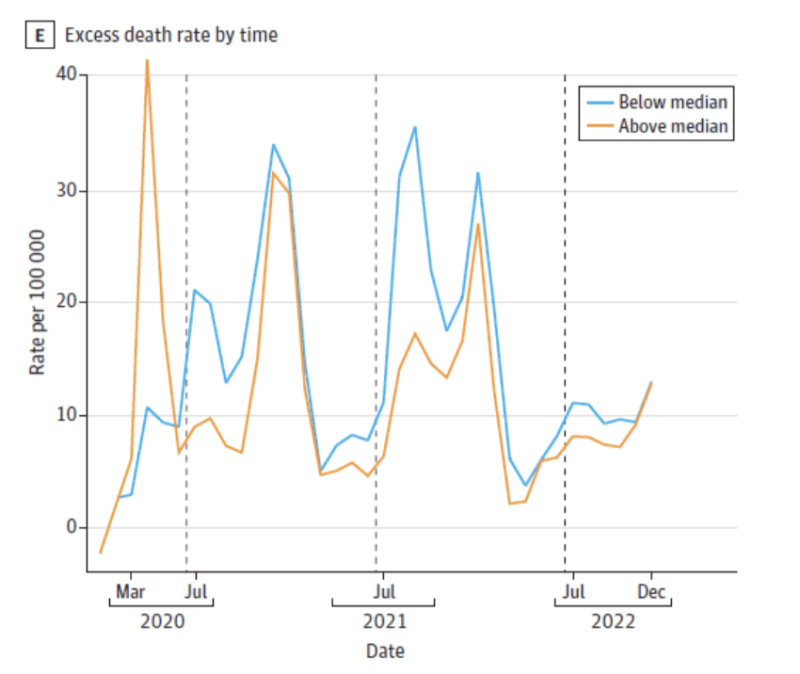
The states with less severe interventions had higher mortality for a month or so after July 2021, which seems to account for almost the entire differential in the primary investigation window. By the end of the window, the orange line ticks up again – what happened next?
Remember the Brazilian study which found that the protective effect of Covid-19 immunization was observed up to one year after the first symptoms, but after one year, the effect was reversed.
Consider also the Estimation of Excess Mortality in Germany During 2020-2022 by Kuhbandner and Reitzner. The authors rightly acknowledge that ‘when interpreting estimates of the increase in mortality, one has to be aware of the model and parameter choices.’
In the later parts of their paper, they map excess mortality since March 2020 against vaccinations in a timeline. It is evident that there are peaks of excess mortality both before and after the vaccination campaign, rising greatly towards the end of the study period:

They conclude:
In 2020, the observed number of deaths was extremely close to the expected number, but in 2021, the observed number of deaths was far above the expected number in the order of twice the empirical standard deviation, and in 2022, above the expected number even more than four times the empirical standard deviation.
This cannot be interpreted as a triumph for the vaccination campaign. It was supposed to prevent excess deaths but did not.
Alessandria et al. published A Critical Analysis of All-Cause Deaths during COVID-19 Vaccination in an Italian Province (Pescara), reanalysing an existing data set to correct for Immortal Time Bias by aligning the population on a single index date (1 January 2021).
They found that:
The all-cause death hazard ratios in univariate analysis for vaccinated people with 1, 2, and 3/4 doses versus unvaccinated people were 0.88, 1.23, and 1.21, respectively. The multivariate values were 2.40, 1.98, and 0.99.
Hazard ratios for third and fourth doses are often lower as these are the most recent ones, and as we have seen in the Brazilian study, initial improvements are reversed later on.
Alessandria et al. finish their report by examining various types of bias that can affect vaccination studies, including a particular type of case-counting window bias, in which results from the first 10-14 days post-vaccination are excluded from the vaccine group in observational studies, with no equivalent for the control group. According to Fung et al., on this basis, ‘a completely ineffective vaccine can appear substantially effective’ (48% effective in the example they calculate using data from the Pfizer Phase III randomised trial).
While putting the finishing touches on my review, the Annals of Internal Medicine released Effectiveness of the 2023-2024 XBB.1.5 Covid-19 vaccines Over Long-Term Follow-up by Ioannou et al. This study tries to emulate a controlled clinical trial by matching XBB.1.5-vaccinated individuals with matched unvaccinated participants. The conclusions are uninspiring:
Vaccine effectiveness against SARS-CoV-2–associated death progressively declined when ascertained after 60, 90, and 120 days of follow-up (54.24%, 44.33%, and 30.26%, respectively) and was even lower (26.61%) when extended to the end of follow-up.
This is represented in Figure 3:

So, the case-counting window appears to be day 10 to day 210. What happens outside the window is not known. If poor results are recorded even with case-counting window bias, the reality must be even worse.
We have been reviewing a selection of observational studies. In the best-case example, the data in these show no material advantage for being vaccinated, and in the worst-case scenario, deaths are greater in the vaccinated group.
There have also been a number of counterfactual studies, in which mortality during the pandemic period is compared with expected mortality.
The first of these by Watson et al. estimated that 14.4 million deaths from Covid-19 had been averted in the first year of vaccination in 185 countries, rising to nearly 20 million when using excess deaths as the measure.
These are extraordinary figures, which have had an extraordinary impact on the public imagination and are frequently referred to in the media. They have been updated in a review by Ioannidis et al. Not surprisingly, given the waning effect of Covid-19 vaccination, these authors arrive at more conservative figures, with over 2.5 million lives saved.
But both studies merely assume the vaccine effectiveness rates they feed into their calculations, with Ioannidis et al. assuming VE of 75% pre-Omicron and 50% during the Omicron period. These are presumably based on the VE found in the clinical trials for symptomatic infections, but an empirical basis for the estimates of mortality averted is not evident.
Modelling is not evidence and does not appear in hierarchical pyramids of evidence-based medicine (EBM). If you assume your treatment is effective, and then calculate its effect on a given population, you will inevitably find – your treatment is effective! The hypothesis is not falsifiable, and the reasoning is circular.
The supposedly extreme threat of the Covid-19 pandemic that panicked governments into emergency measures was created in large part by modelling, which assumed that extremely high levels of deaths would occur without novel countermeasures. Pandemania ensued and should never be repeated. Retrospectively, the orthodox now attempt to show that because these fictional levels of mortality did not eventuate, this was because of the countermeasures.
Three possible scenarios for medium-term mortality emerge from these studies:
- VE = 50-70%
- VE = 0%
- VE is negative
Empirical evidence for the first scenario is lacking. The other scenarios are unacceptable. Scenario 2 is unacceptable because we cannot administer treatments to people if there is no benefit and they may be exposed to adverse effects, and the adverse effects of the Covid-19 vaccines are unusually high, as Fraiman et al. have shown.
The adverse effects of lockdowns continue to accumulate, too, especially on the mental health and educational levels of young people. According to Ferwana and Varshney:
Results show that lockdown has significantly and causally increased the usage of mental health facilities in regions with lockdowns in comparison to regions without such lockdowns. Particularly, resource usage increased by 18% in regions with a lockdown compared to 1% decline in regions without a lockdown. Also, female populations have been exposed to a larger lockdown effect on their mental health. Diagnosis of panic disorders and reaction to severe stress significantly increased by the lockdown. Mental health was more sensitive to lockdowns than to the presence of the pandemic itself.
The pandemic strategy was the greatest public health experiment in history. As chairman of a human research ethics committee, I would vote against any proposal where the net benefits were likely to be either zero or worse. Benefits must demonstrably exceed risks.
In my hometown of Melbourne, Victoria, the entire population was confined to home detention for 262 days overall. Severe vaccination mandates were then imposed on all ‘essential workers’ (and nearly all workers turned out to be essential), and the unvaccinated were locked out of public places and regarded as a health hazard. Like other island nations, Australia did quite well during the period when it shut the borders, but the grand strategy did not work – after the interim NPI period, the arrival of vaccination did not prevent excess mortality as it was supposed to:

An essential principle should be that the more serious the breaches of individual liberty brought about by public health measures, the more hard evidence of their effectiveness is needed.
Governments should not be able to trample on individual liberties because they think that their interventions might work in theory, and then retrospectively justify them with statistical magic.


